No annual news event in Kenya screams data visualisation like the Budget reading at the national assembly. Yet the charts published by the media after this year’s budget was read were underwhelming, few and sometimes inaccurate.
Take the case of The Daily Nation. While the main budget chart in the print version of daily (see right) was simple but informative, the online version was a joke.
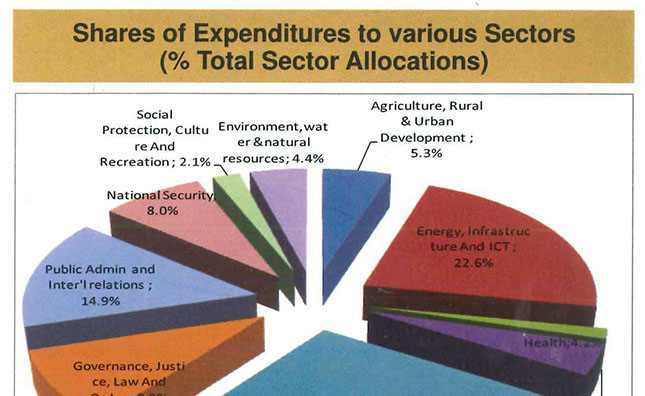
The messy chart has no headline or caption describing what data is shown in the chart – instead its description seems to be a misplaced photo caption. Parts of the words in the labels are broken inappropriately and the chart has a mix of labelling styles. Some of the labels are inside the pie while others are outside it. The source of the data is not given and most worryingly of all – the data is different!
Somehow the governance piece of the pie is missing, while the education, infrastructure and public administration budgets have gotten a boost of two to three percent. I suspect the fault might have occurred as the person creating the chart, was trying to round of the number, which in its own is kind of unnecessary as the data was already down to one digit.
The graphic designer hired by the treasury to make their Mwanainchi Guide (which was distributed with the major dailies on the day following the reading) also has some self-reflection to do. Why did he or she use a 3D chart to illustrate this important data? Was it plain ignorance?
3D charts are more or less banned in the world of data visualisation because the brains low capacity of estimating and comparing volumes. 3D effects also confuse the brain in the way that a pie in front is conceived as much bigger than one in the back even when the percentage they represent may be similar.
There is light at the end of the tunnel though. The Daily Nation’s sister publication Business Daily, explains the 2014-2015 budget using a beautiful tree map on their website.
The weekly magazine visualised the whole budget, not just the breakdown of expenditures to sectors. This comprehensive view reveals that the largest post in the budget actually is “Consolidated Funds Service”, with a spending of Sh363 billion equivalents to about 20 percent of the budget. This means that one out of every Sh5 allocated in the budget this year goes towards paying of the Kenya’s debts.